
Power BI
- Home
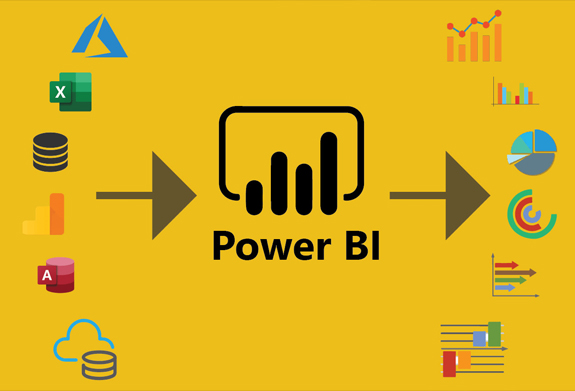
- Power BI
Power BI Online Training in Hyderabad
Best Power BI Online Training Institute in Hyderabad
This course is in association with Power BI front line industry experts and it works towards helping students develop skills in concepts like Data Modeling, Data Visualizations, Data Exploration with Dashboards, DAX functionality and many other topics. Joining this course would undoubtedly be an apt choice for both budding Business Analysts and Big Data professionals. In this Power BI Online Course Students will be learning the topics right from the very basics to advanced level topics by working on multiple projects and assignments.
Microsoft Power BI is an advanced Business development platform developed by the Microsoft organization. Using this tool, we can easily transform an organizations data into rich visuals. This tool helps business analysts in generating a panoramic view of business to help the viewers gauge updates in real-time. This Power BI Online Training will give you clear knowledge of how to transform data into rich visuals. Post training completion, we do support our students with 100% placement assistance.
Power BI Syllabus
- Introduction to Power BI – Need, Imprtance
- Power BI – Advantages and Scalable Options
- History – Power View, Power Query, Power Pivot
- Power BI Data Source Library and DW Files
- Cloud Colloboration and Usage Scope
- Business Analyst Tools, MS Cloud Tools
- Power BI Installation and Cloud Account
- Power BI Cloud and Power BI Service
- Power BI Architecture and Data Access
- OnPremise Data Acces and Microsoft On Drive
- Power BI Desktop – Instalation, Usage
- Sample Reports and Visualization Controls
- Power BI Cloud Account Configuration
- Understanding Desktop & Mobile Editions
- Report Rendering Options and End User Access
- Power View and Power Map. Power BI Licenses
- Course Plan – Power BI Online Training
- Report Design with Legacy & .DAT Files
- Report Design with Databse Tables
- Understanding Power BI Report Designer
- Report Canvas, Report Pages: Creation, Renames
- Report Visuals, Fields and UI Options
- Experimenting Visual Interactions, Advantages
- Reports with Multiple Pages and Advantages
- Pages with Multiple Visualizations. Data Access
- PUBLISH Options and Report Verification in Cloud
- “GET DATA” Options and Report Fields, Filters
- Report View Options: Full, Fit Page, Width Scale
- Report Design using Databases & Queries
- Query Settings and Data Preloads
- Navigation Options and Report Refresh
- Stacked bar chart, Stacked column chart
- Clustered bar chart, Clustered column chart
- Adding Report Titles. Report Format Options
- Focus Mode, Explore and Export Settings
- Power BI Design: Canvas, Visualizations and Fileds
- Import Data Options with Power BI Model, Advantages
- Direct Query Options and Real-time (LIVE) Data Access
- Data Fields and Filters with Visualizations
- Visualization Filters, Page Filters, Report Filters
- Conditional Filters and Clearing. Testing Sets
- Creating Customised Tables with Power BI Editor
- General Properties, Sizing, Dimensions, and Positions
- Alternate Text and Tiles. Header (Column, Row) Properties
- Grid Properties (Vertical, Horizontal) and Styles
- Table Styles & Alternate Row Colors – Static, Dynamic
- Sparse, Flashy Rows, Condensed Table Reports. Focus Mode
- Totals Computations, Background. Boders Properties
- Column Headers, Column Formatting, Value Properties
- Conditional Formatting Options – Color Scale
- Page Level Filters and Report Level Filters
- Visual-Level Filters and Format Options
- Report Fields, Formats and Analytics
- Page-Level Filters and Column Formatting, Filters
- Background Properties, Borders and Lock Aspect
- CHART Report Types and Properties
- STACKED BAR CHART, STACKED COLUMN CHART
- CLUSTERED BAR CHART, CLUSTERED COLUMN CHART
- 100% STACKED BAR CHART, 100% STACKED COLUMN CHART
- LINE CHARTS, AREA CHARTS, STACKED AREA CHARTS
- LINE AND STACKED ROW CHARTS
- LINE AND STACKED COLUMN CHARTS
- WATERFALL CHART, SCATTER CHART, PIE CHART
- Field Properties: Axis, Legend, Value, Tooltip
- Field Properties: Color Saturation, Filters Types
- Formats: Legend, Axis, Data Labels, Plot Area
- Data Labels: Visibility, Color and Display Units
- Data Labels: Precision, Position, Text Options
- Analytics: Constant Line, Position, Labels
- Working with Waterfall Charts and Default Values
- Modifying Legends and Visual Filters – Options
- Map Reports: Working with Map Reports
- Hierarchies: Grouping Multiple Report Fields
- Hierarchy Levels and Usages in Visualizations
- Preordered Attribute Collection – Advantages
- Using Field Hierarchies with Chart Reports
- Advanced Query Mode @ Connection Settings – Options
- Direct Import and In-memory Loads, Advantages
- Hierarchies and Drilldown Options
- Hierarchy Levels and Drill Modes – Usage
- Drill-thru Options with Tree Map and Pie Chart
- Higher Levels and Next Level Navigation Options
- Aggregates with Bottom/Up Navigations. Rules
- Multi Field Aggregations and Hierarchies in Power BI
- DRILLDOWN, SHOWNEXTLEVEL, EXPANDTONEXTLEVEL
- SEE DATA and SEE RECORDS Options. Differences
- Toggle Options with Tabular Data. Filters
- Drilldown Buttons and Mouse Hover Options @ Visuals
- Dependant Aggregations, Independant Aggregations
- Automated Records Selection with Tabular Data
- Report Parameters : Creation and Data Type
- Available Values and Default values. Member Values
- Parameters for Column Data and Table / Query Filters
- Parameters Creation – Query Mode, UI Option
- Linking Parameters to Query Columns – Options
- Edit Query Options and Parameter Manage Entries
- Connection Parameters and Dynamic Data Sources
- Synonyms – Creation and Usage Options
- Understanding Power Query Editor – Options
- Power BI Interface and Query / Dataset Edits
- Working with Empty Tables and Load / Edits
- Empty Table Names and Header Row Promotions
- Undo Headers Options. Blank Columns Detection
- Data Imports and Query Marking in Query Editor
- JSON Files & Binary Formats with Power Query
- JavaScript Object Notation – Usage with M Lang.
- Applied Steps and Usage Options. Revert Options
- creating Query Groups and Query References. Usage
- Query Rename, Load Enable and Data Refresh Options
- Combine Queries – Merge Join and Anti-Join Options
- Combine Queries – Union and Union All as New Dataset
- M Language : NestedJoin and JoinKind Functions
- REPLACE, REMOVE ROWS, REMOVE COL, BLANK – M Lang
- Column Splits and FilledUp / FilledDown Options
- Query Hide and Change Type Options. Code Generation
- Purpose of Data Analysis Expresssions (DAX)
- Scope of Usage with DAX. Usabilty Options
- DAX Context : Row Context and Filter Context
- DAX Entities : Calculated Columns and Measures
- DAX Data Types : Numeric, Boolean, Variant, Currency
- Datetime Data Tye with DAX. Comparison with Excel
- DAX Operators & Symbols. Usage. Operator Priority
- Parenthesis, Comparison, Arthmetic, Text, Logic
- DAX Functions and Types: Table Valued Functions
- Filter, Aggregation and Time Intelligence Functions
- Information Functions, Logical, Parent-Child Functions
- Statistical and Text Functions. Formulas and Queries
- Syntax Requirements with DAX. Differences with Excel
- Naming Conventions and DAX Format Representation
- Working with Special Characters in Table Names
- Attribute / Column Scope with DAX – Examples
- Measure / Column Scope with DAX – Examples
- YTD, QTD, MTD Calculations with DAX
- DAX Calculations and Measures
- Using TOPN, RANKX, RANK.EQ
- Computations using STDEV & VAR
- SAMPLE Function, COUNTALL, ISERROR
- ISTEXT, DATEFORMAT, TIMEFORMAT
- Time Intelligence Functions with DAX
- Data Analysis Expressions and Functions
- DATESYTD, DATESQTD, DATESMTD
- ENDOFYEAR, ENDOFQUARTER,ENDOFMONTH
- FIRSTDATE, LASTDATE, DATESBETWEEN
- CLOSINGBALANCEYEAR,CLOSINGBALANCEQTR
- SAMEPERIOD and PREVIOUSMONTH,QUARTER
- KPIs with DAX. Vertipaq Queries in DAX
- IF..ELSEIF.. Conditions with DAX
- Slicing and Dicing Options with Columns, Measures
- DAX for Query Extraction, Data Mashup Operations
- Calcualted COlumns and Calculated Measures with DAX
- PowerBI Report Validation and Publish
- Understanding PowerBI Cloud Architecture
- PowerBI Cloud Account and Workspace
- Reports and DataSet Items Validation
- Dashboards and Pins – Real-time Usage
- Dynamic Data Sources and Encryptions
- Personal and Organizational Content Packs
- Gateways, Subscriptions, Mobile Reports
- Data Refresh with Power BI Architecture
- PBIX and PBIT Files with Power BI – Usage
- Visual Data Imprts and Visual Schemas
- Cloud and On-Premise Data Sources
- How PowerBI Supports Data Model?
- Relation between Dashbaords to Reports
- Relation between Datasets to Reports
- Relation between Datasets to Dashbaords
- Page to Report – Mapping Options
- Publish Options and Data Import Options
- Need for PINS @ Visuals and PINS @ Reports
- Need for Data Streams and Cloud Intergration
- Report Publish Options and Verifications
- Working with Power BI Cloud Interface & Options
- Navigation Paths with “My Workspace” Screens
- FILE, VIEW, EDIT REPORTS, ACCESS, DRILLDOWN
- Saving Reports into pdf, pptx, etc. Report Embed
- Report Rendering and EDIT, SAVE, Print Options
- Report PIN and individual Visual PIN Options
- Create and Use Dashboards. Menu Options
- Goto Dashboard and Goto LIVE Page Options
- Operations on Pinned Reports and Visuals
- TITLE, MEDIA, USAGE METRICS & FAVOURITES
- SUBSCRIPTION Options and Reports with Mobile View
- Options with Report Page : Print and Subscribe
- Report Actions: USAGE METRICS, ANALYSE IN EXCEL
- Report Actions: RELATED ITEMS, RENAME, DELETE
- Dashboard Actions: METRICS, RELATED ITEMS
- Dashboard Actions: SETTINGS FOR Q & A, DELETE
- PIN Actions: METRICS, SHARE, RELATED ITEMS
- PIN Actions: SETTINGS FOR Q & A, DELETE
- EDIT DASHBOARD (CLOUD), On-The-Fly Reports
- Dataset Actions: CREATE REPORT, REFRESH
- SCHEDULED REFRESH & RELATED ITEMS
- Dashboard Integration with Apps in Power BI